
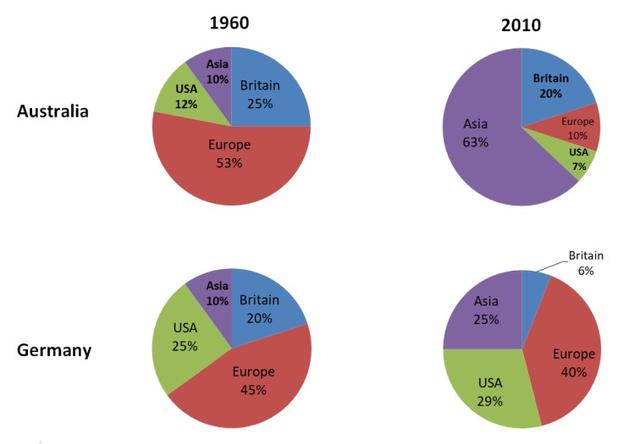
These two charts present the comparison in the makeup of
tourists
to Australia and Germany between 1960 and 2010.
In Australia, the percentage of European Use synonyms
tourists
shrunk during the 50-year period, from 53% in 1960 to only Use synonyms
a
10% in 2010. The contributions of American and British Correct article usage
apply
tourists
Use synonyms
also
declined but to a lesser extent - 12% to 7% and 25% to 20% respectively. Linking Words
On the other hand
, the makeup of Asian Linking Words
tourists
in Australia increased dramatically - from only a tenth in 1960 to over half in 2010.
As for Germany, the contributions of American and European Use synonyms
tourists
remain relatively unchanged - 25% to 29% and 45% to 40% respectively. Use synonyms
However
, the makeup of British and Asian Linking Words
tourists
Use synonyms
seem
to have flipped over the period - in 1960, Britain made up Correct subject-verb agreement
seems
for
20% - twice that of Asian countries - Change preposition
apply
while
50 years later Asia contributed a quarter - about four times as Britain.Linking Words