
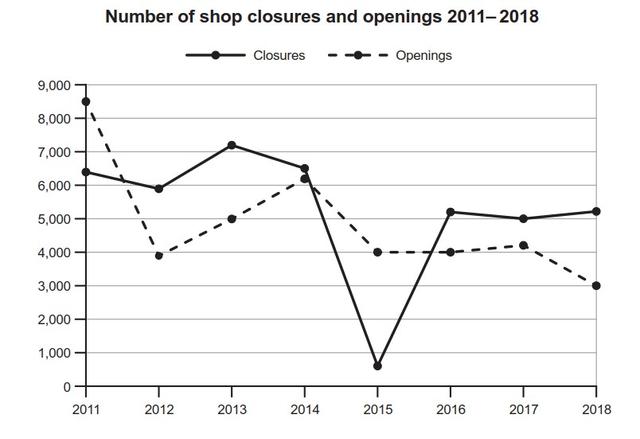
The provided line graph illustrates the
number
of shop closures and openings in a nation from 2011 to 2018.
Use synonyms
Overall
, the Linking Words
number
of new showrooms reduced significantly throughout the period but fluctuated in closed shops. Despite that, many showrooms were closed during the period.
In 2011, nearly 8500 stores were opened and Use synonyms
then
experienced a significant fall of 4000 in 2012 before it recovered steadily and reached 6000 units. Linking Words
However
, after 2014, new openings continued to decrease and hit a low of 3000 by 2018, Linking Words
while
having a levelled-off period from 2015 to 2017.
Linking Words
On the other hand
, the Linking Words
number
of closed outlets started at 6500 and fluctuated till 2014. Use synonyms
Then
suddenly dropped to around 500 in 2015 and recovered to just over 5000 in the next year. Linking Words
Although
, in 2013 the Linking Words
number
of closed shops hit its peak (7000 units). In the Use synonyms
last
couple of years, the Linking Words
number
of closed stores was insignificantly reduced and recovered back.Use synonyms