
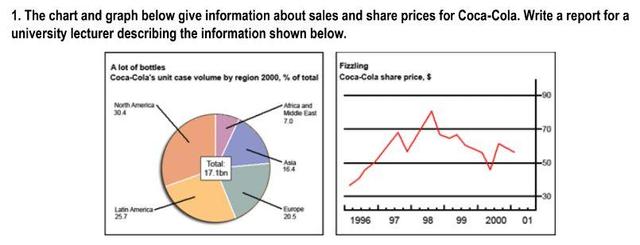
The pie chart and graph illustrate some percentages about
Coca-Cola
's unit case volume by region in 2000 and share Use synonyms
prices
.
Use synonyms
Firstly
, there was an increase between the years 1996 and 1997 in Linking Words
Coca-Cola
share Use synonyms
prices
to 70. Followed by a slight drop, Use synonyms
then
it increased again to 80 in 1998. Linking Words
Moreover
, the Linking Words
prices
kept decreasing until the year 2000 to almost 40, Use synonyms
then
Linking Words
it
rose again in 2001 to 60. Correct pronoun usage
they
Secondly
, the largest proportion of sales of Linking Words
Coca-Cola
's unit case volume by region in 2000 was in North America, 30.4 of the total. Use synonyms
Therefore
, the second biggest number in sales is in Latin America, 25.7. For the 3rd place comes Europe at 20.5. Linking Words
In addition
, the least two regions were in Asia Linking Words
and
(Africa and the Middle East), 16.4 and 7,0.
Correct word choice
apply
Overall
, Linking Words
Coca-Cola
share Use synonyms
prices
in the year 1998 were the highest among other years, Use synonyms
although
they were at their lowest in 1996. Linking Words
Also
, Linking Words
Coca-Cola
sales were the most in North America and the least in (Africa and the Middle East).Use synonyms