
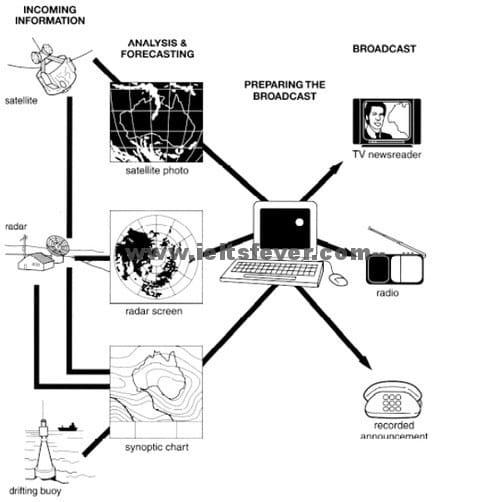
The diagram illustrates the data-collecting process of up-to-date forecasts of the Australian Bureau of Meteorology which is for providing true knowledge.
In general, there are four main stages that three of which have their own different ways. The whole cycle starts with observing data and ends with announcing it to the world.
The first stage begins when a satellite sends a photo of the earth from space
while
from the earth's surface, people can monitor the drifting buoy's synoptic chart. Linking Words
Secondly
, both of these incoming data are analyzed and can be observed on the radar screen.
In the third process, the broadcasting centre will receive the forecast and makes sure that the details are true, simply obtaining the news from all three methods and Linking Words
this
is followed by the preparation to release updated information. Ultimately, the TV newsreaders and radio announcers will report the prediction to the public, or it can be recorded on a telephone to the receiver.Linking Words