
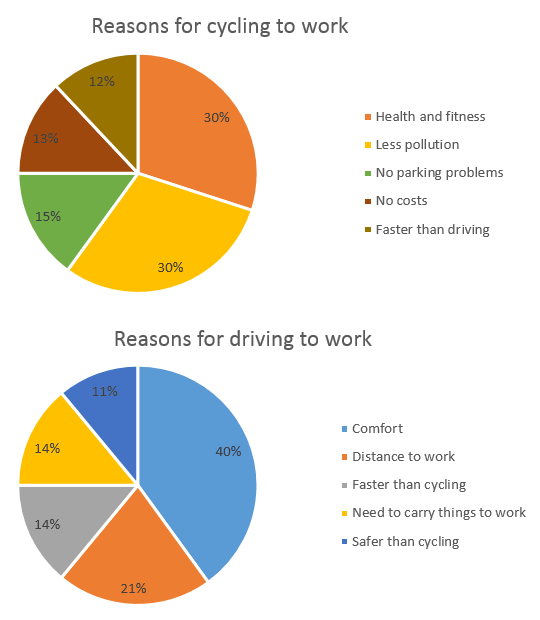
The two pie charts give information on the basis of reasons why people choose to go to go to
work
by cycle or drive. Units are measured in percentage.
Use synonyms
Overall
, it is noticeable that the largest proportion of people who ride bicycles made Linking Words
this
choice for health and environmental reasons, whilst the main advantage of driving to Linking Words
work
is considered to be the comfort of travelling by car.
Use synonyms
According to
information of information, health and fitness and less pollution are reasons ven bof allover half of all people who prefer travellingreasone, each reason accFurthermore 3theurthermore, the next r reason is a lack of parking issues with 15%.
As for driving by car, comfort is vitally important fomakingpeople, making up 40%. Linking Words
By contrast
, distance to Linking Words
work
is a more significant concern for just over a fifth of drivers. Use synonyms
Also
, faster than the needing and the need to carry things to Linking Words
work
were almost similar, at 14%.Use synonyms