
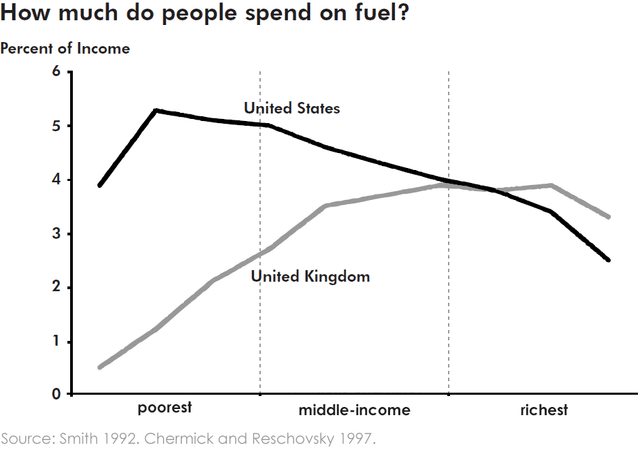
The Line graph describes the amount of petrol that
people
Use synonyms
use
in the United Use synonyms
States
and the United Use synonyms
Kingdom
.
From the Use synonyms
overall
perspective,the richest in the United Linking Words
States
Use synonyms
spends
the least Correct subject-verb agreement
spend
Use synonyms
percent
of Change the spelling
per cent
income
Use synonyms
for
Change preposition
on
fuel
Use synonyms
while
the poorest in the United Linking Words
Kingdom
Use synonyms
use
the least Use synonyms
fuel
.
In Use synonyms
United
Correct article usage
the United
Kingdom
, Use synonyms
people
who have Use synonyms
the
Correct article usage
apply
low
Add a hyphen
low-income
income
Use synonyms
use
from 0.5 of Use synonyms
income
to over 2 Use synonyms
Use synonyms
percent
of Change the spelling
per cent
income
.Use synonyms
However
,in the United Linking Words
States
,about 4 or 5 Use synonyms
Use synonyms
percent
of Change the spelling
per cent
income
is used for Use synonyms
fuel
among the poorest.For the Use synonyms
people
who have middle Use synonyms
income
,in the United Use synonyms
States
,they Use synonyms
use
less Use synonyms
fuel
than the poor Use synonyms
people
but in the United Use synonyms
Kingdom
,they Use synonyms
use
more Use synonyms
fuel
.
In the United Use synonyms
States
,the Use synonyms
use
of Use synonyms
fuel
decreases in the percentage of Use synonyms
income
among the richest and it is between 2 and 4 Use synonyms
percent
.Use synonyms
On the other hand
,in the United Linking Words
Kingdom
,the more they Use synonyms
rich
,the more they spend on Add a missing verb
are rich
fuel
and it is about 4 Use synonyms
Use synonyms
percent
of their Change the spelling
per cent
income
rate.Use synonyms