
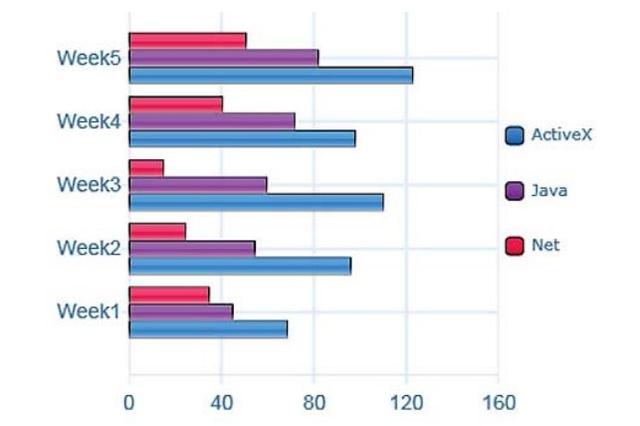
The bar graph provides information on what type of computer packages were downloaded from the internet during the five weeks.
Overall
, the ActiveX package shows the highest for downloading Linking Words
whereas
the Net software was the least downloaded in the given period.
During Linking Words
week
1, the ActiveX software took the lead approximately 60 times and ever since it reached almost 115 times and was downloaded by Use synonyms
week
3, Use synonyms
then
it shrank a little bit in the next Linking Words
week
and by Use synonyms
week
5 it hit an all-time high of more than 120 download. Use synonyms
Furthermore
, the Java package was the second highest downloading software which was increasing moderately every Linking Words
week
starting from an average of 45 and ending with 80 downloads.
Use synonyms
Lastly
, the Net package was performing below 40 for four weeks and during that time it depleted to a time low of 20 downloads and in the Linking Words
last
Linking Words
week
it gradually surge to 45 average downloads.Use synonyms