
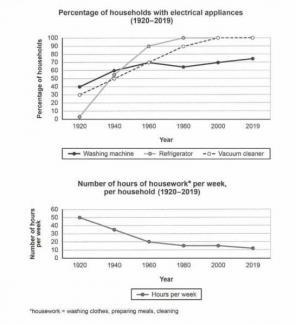
The charts illustrate the trends in the number of families possessing electrical appliances and the time they spent washing clothes, preparing meals and cleaning in one region from 1920 to 2019.
Overall
, the amount of time spent weekly by families doing the housework witnessed a decrease for the given period Linking Words
this
was Linking Words
due to
the fact that the percentage of households owing washing machines, refrigerators, and vacuum cleaners increased.
Houses used 50 hours of their week doing housework in 1920 and it decreased steadily till 1980 arriving at nearly 25 hours per week. It experienced a continuous fall till the end of the period and arrived at 10 hours per week.
In 1920 the rate of households possessing washing machine and vacuum cleaner were 40% and 30% respectively, at the same time, the percentage of houses having refrigerator was insignificantly low (0%). There was a sharp increase in the rate of households owning refrigerators and vacuum cleaners between 1920 to 1980 arriving at 100 % both. The number of families having washing machines experienced a stable rise from 1920 to 1960 and remained nearly unchanged for the rest of the period.Linking Words