
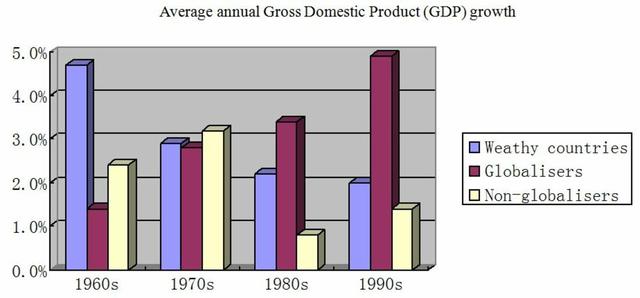
The bar chart presents the standard increment in national merchandise in affluent countries, regions that have been internationally integrated with business and those that have not.
Overall
, in lieu of a poorly commencing, globalised annual growth in domestic industrials took the lead by the end of the given time. Linking Words
On the contrary
, its wealthy region and non-globalizers witnessed a decreasing trend.
In 1960, the average growth of wealthy communities in domestic products accounted for approximately 5%. Linking Words
Subsequently
, it notably fell as time went by, specifically, in 1970, the rate was 3%, Linking Words
then
nearly 2.1% in 1980, eventually hitting a low at 2% in 1990. Linking Words
On the other hand
, the increment of nation’s products in countries in the globalization process experienced the opposite. It initiated at roughly 1% in 1960, followed by a hover around 3% between 1970 and 1980, Linking Words
then
reached a peak at 5% in 1990.
From 1960 to 1970, non-globalizers standard growth of the given goods gradually escalated from approximately 2% to 3%. In 1980, it significantly plummeted to around 1%. From the remainder of the given time, it slightly increased to 1.2% in 1990Linking Words