
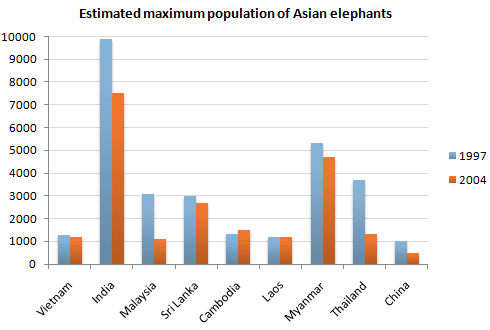
The graph chart provides information on the estimation of Asian
elephants
' greatest population over a seven-year period in different countries. Use synonyms
Overall
, in 2004, the number of Asian Linking Words
elephants
experienced a downward trend, especially in India, Malaysia and Thailand where they decreased significantly.
Use synonyms
According to
the graph, Linking Words
Although
India had the most Linking Words
elephants
both in 1997 and 2004, these numbers dropped sharply from just under 10,000 to around 7,500. Use synonyms
Similarly
, Thailand and Malaysia Linking Words
also
displayed precipitous downturns, dipping approximately 2,000 Linking Words
elephants
between 1997 and 2004. Meanwhile, other countries Use synonyms
such
as Vietnam, Sri Lanka, Myanmar and China, illustrated a gentle fall of less than 1,000 Linking Words
elephants
over the 20-year period.
Meanwhile, Laos was the only nation that remained stable, hovering just over 1,000 Use synonyms
elephants
in those two time periods (1997 and 2004). Use synonyms
In contrast
to the remaining nations, Cambodia was the only one that had a surge of Linking Words
elephants
, gradually peaking at approximately 1,500.Use synonyms