
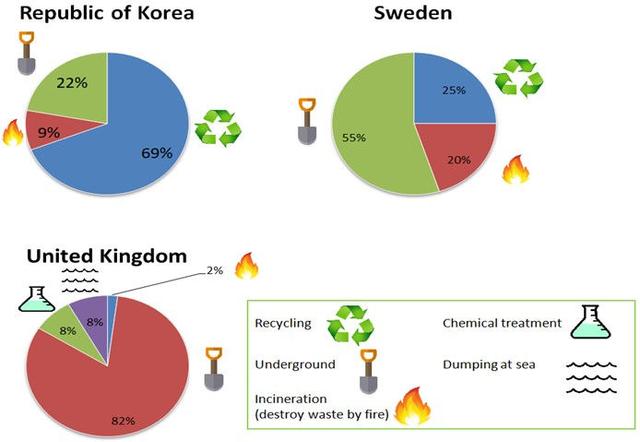
The three pie charts give information about the different ways of treating dangerous
waste
in three countries.
Use synonyms
It is clear that
those nations exploit multiple means of treatment for the products, but they all burn and bury some of the Linking Words
waste
.
Dangerous Use synonyms
waste
materials are mainly recycled in South Korea, at 69%, Use synonyms
while
the figure in Sweden is only a quarter of them, and the UK recycles nothing. Linking Words
By contrast
, Britain puts 82% of those products underground, which is followed by Sweden, at 55%, Linking Words
whereas
the percentage in the Asian country only stands at 22%.
With regard to incineration, one-fifth of dangerous Linking Words
waste
products are burnt in the Nordic country which outstrips the proportions of the other two countries combined, which are at 9% and 2% respectively. In the UK, those Use synonyms
waste
materials are Use synonyms
also
treated by chemical treatment and dumping at sea, at 8% respectively, both of which are not used in the Republic of Korea and Sweden.Linking Words