
This
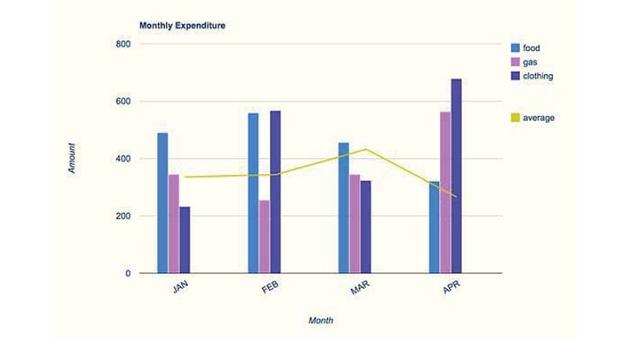
bar graph illustrates, by three different types of items, how much money people spent on domestic expenses between January and April of 2010. Linking Words
Overall
, costs of Linking Words
gas
and clothing experienced an upward trend, Use synonyms
while
those of food experienced a downward trend throughout the whole time frame.
Focusing on house expenses of Linking Words
gas
and clothing, Use synonyms
although
clothing was the smallest category at around $200, Linking Words
gas
was at over $300 at the beginning of the Use synonyms
month
. Despite the fact that Use synonyms
gas
showed a dip at around $250 in February, in the Use synonyms
last
Linking Words
month
it recorded the Use synonyms
second highest
expenditure at under $600. Add a hyphen
second-highest
On the other hand
, costs of clothing depicted a fluctuation, reaching a peak of under $600 in Feb, and the highest at under $700 Linking Words
at the end
of the Linking Words
month
.
Turning to the domestic expenditure Use synonyms
of
food, it Change preposition
on
was
increased by approximately $50 from Jan to Feb, reaching almost the same level as the costs of clothing. Unnecessary verb
apply
However
, it decreased gradually and was recorded at around $300, which was the lowest amount in the final Linking Words
month
.
Use synonyms
Finally
, the average of amounts was steady at around over $300 over the first two months, Linking Words
whereas
it reached a peak of over $400 and decreased to under $300 on Apr.Linking Words