
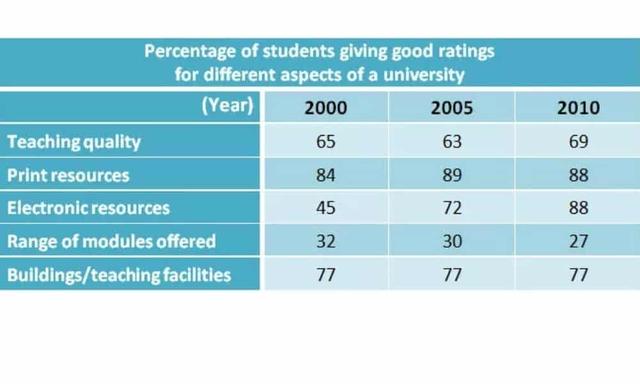
The data describes the percentage of pupils who gave ratings for five different categories in 2000, 2005, and 2010 in a university. The unit
that is
used is shown in percentage. Linking Words
This
writing will give some important features of the table and compare them when necessary.
Linking Words
Overall
, there are five categories of aspects that are reviewed by the students in an educational institution. Linking Words
Moreover
, the value ranges between 27 and 89, where 27 per cent is the minimum value, Linking Words
while
89 is the maximum.
To start with, building and teaching facilities are rated constantly, getting 77% throughout the year. Linking Words
In addition
, electronic resources were getting much better from 2000 to 2010, climbing from 45% to 88%. Linking Words
On the other hand
, Linking Words
range
of modules offered was getting worse, falling from 32% to 27% as time went by.
Correct article usage
the range
Besides
, there are two categories that are not gaining many points but slightly improving. Technical quality of the university and print resources were improving from 2000 to 2010, but they experienced a downward in 2005 and got back up in 2010.Linking Words