
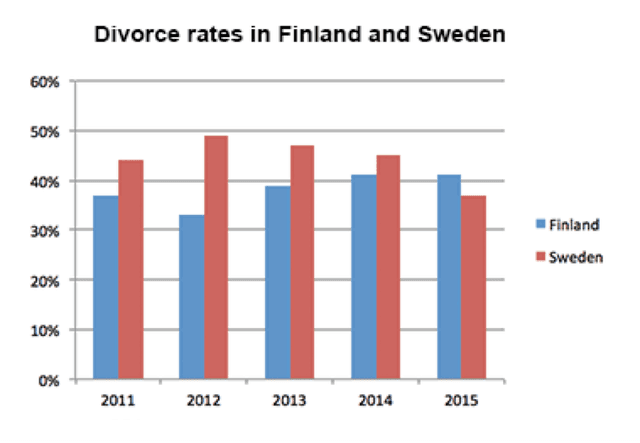
The bar chart illustrates the separation rates in two different European countries (
Finland
and Use synonyms
Sweden
) between 2001 and 2015. It is measured in percentages.
Use synonyms
Overall
, Linking Words
it is clear that
the percentage of divorce in Linking Words
Sweden
decreased Use synonyms
while
Linking Words
Finland
increased over the period given. Both figures fluctuated from 2011 to 2015. At the beginning of the period in 2011, the proportion of splitting up rate in Use synonyms
Sweden
was the highest and in 2015, the highest rate was in Use synonyms
Finland
.
The percentage of divorce rates in Use synonyms
Sweden
started at around 43% in 2011 and Use synonyms
then
rose slightly to peak at just under 50% in 2012. After 2012, Linking Words
this
figure declined slowly to 44% in 2014 and dropped quickly to approximately 38% in 2015.
Linking Words
In contrast
, the proportion of breakup rates in Linking Words
Finland
began at more or less 37% in 2011 Use synonyms
then
fluctuated from 2011 to 2013 and Linking Words
then
rose steadily to almost over 40% in 2014 and remained stable over the Linking Words
last
year.Linking Words