
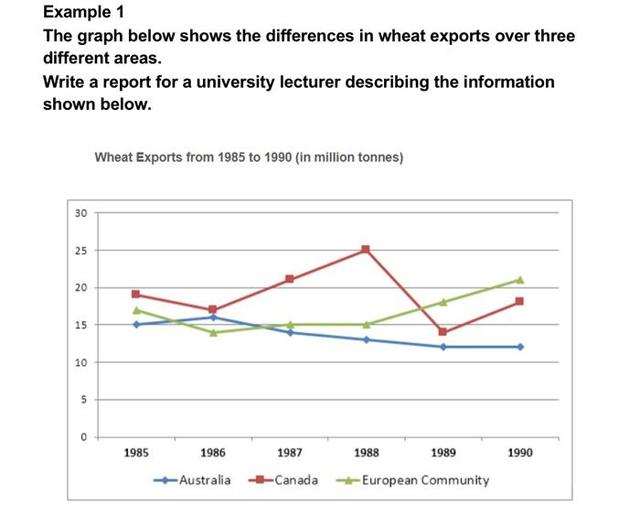
The line graph compares three regions in terms of
exports
of Use synonyms
wheat
between 1985 and 1990.
Use synonyms
Overall
, the three regions experienced different trends in the time period. Linking Words
While
the Linking Words
wheat
export in Canada and European countries rose with some fluctuations, the export in Australia fell over time.
As the graph shows, Australia's Use synonyms
wheat
export figure started at 15 Use synonyms
million
Use synonyms
tons
in 1985 followed by a small increase to around 16 Use synonyms
million
Use synonyms
tons
in 1986. Use synonyms
Then
, it declined steadily until it fell to just over 10 Linking Words
million
Use synonyms
tons
in 1990. Regarding Canada's Use synonyms
exports
, in 1985 they shipped approximately 19 Use synonyms
million
Use synonyms
tons
of Use synonyms
wheat
. Use synonyms
this
figure fell to about 17 Linking Words
million
in 1986, but Use synonyms
then
their Linking Words
exports
experienced considerable growth to 25 Use synonyms
million
Use synonyms
tons
in 1998. Afterwards, the figure plunged to below 15 Use synonyms
million
in 1989Use synonyms
,
but Remove the comma
apply
subsequently
rose to just under 20 Linking Words
million
in 1990.
Use synonyms
By contrast
, Linking Words
wheat
Use synonyms
exports
from the European Community experienced an increase in the six-year period. In 1985, nearly 16 Use synonyms
million
Use synonyms
tons
were exported, but Use synonyms
this
number fell to about 14 Linking Words
million
in 1986. Use synonyms
Then
, the Linking Words
exports
increased to exactly 15 Use synonyms
million
Use synonyms
tons
in 1987 and 19898 before witnessing steady growth to 19 Use synonyms
million
and 21 Use synonyms
million
Use synonyms
tons
in 1989 and 1990, respectively.Use synonyms
jonahid.stu20ju