
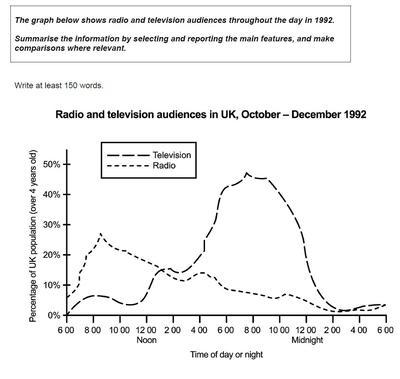
The graph illustrates how much the percentage of people watching television has changed at different times of the day ,in 1992.
Overall
, at the beginning of the day, most people watch television , Linking Words
while
Linking Words
at the end
of the Linking Words
,
daytime the biggest percentage of individuals listen to the radio ,Remove the comma
apply
this
being the most practised activity.
Linking Words
Firstly
, starting with the public who listened to the radio, at 6 o'clock Linking Words
this
number started to increase until 8 , when it reached its peak of nearly 30%. Linking Words
Then
, Linking Words
this
number decreased slowly until 4 o'clock, being nearly 0%, and Linking Words
then
it started to grow a little bit again.
Linking Words
Secondly
, continuing with the people who watched television ,Linking Words
this
value increased at an irregular rate , with different variations ,until 10 o'clock at midnight when it reached its peak ,close to 50% ,and Linking Words
then
decreased sharply, becoming nearly 0%. The only time of the daytime when the same amount of individuals listened to the radio as the number watching TV was at 1 at noon.Linking Words