
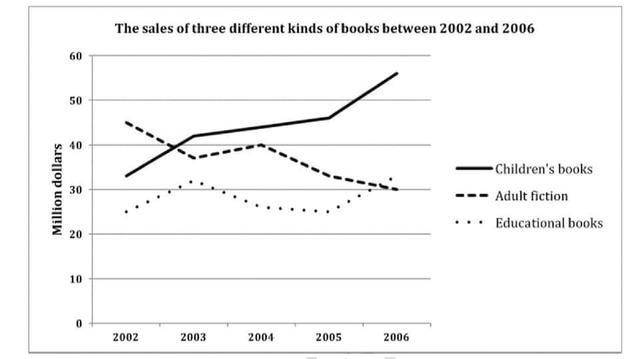
The graph describes the number of revenues from three different genres of
books
separated from the Use synonyms
year
2002 to 2006, namely fictional, educational, and children. As observed from the chart, there was more appreciation for the children’s genre than the other Use synonyms
books
.
Since 2002, Use synonyms
books
for the younger population experienced a gradual increase from around 30 Use synonyms
million
dollars to as high as 55 Use synonyms
million
in 2006, Use synonyms
while
surpassing the sales of adult fiction one Linking Words
year
after the data was recorded. The latter topics had a disappointing pattern. Raked the highest revenue in 2002 by 45 Use synonyms
million
dollars, the fictional novel continued to regress until reached the lowest amount of Use synonyms
books
sold in 2006 by less than 30 Use synonyms
million
, even getting passed by educational Use synonyms
books
. Education publications that were once positioned as the lowest customer shares in the first Use synonyms
year
slowly gained more revenue by around 30 Use synonyms
million
dollars in 2006, similar to the incomes gained in the Use synonyms
year
2003.Use synonyms