
This
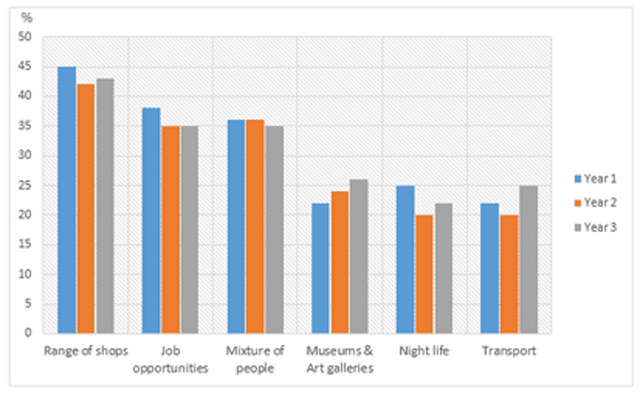
chart illustrates the percentage of interesting things about Linking Words
London
by its people's thoughts. It is divided into 6 sectors, which are the range of shops, job opportunities, the mixture of community, museum and art galleries, Use synonyms
nightlife
, and transport from a 3-year Use synonyms
survey
. Use synonyms
Overall
, most society thought that the range of shops was the most attractive thing in Linking Words
London
.
In the first-year Use synonyms
survey
, it shows that the less interesting scope from Use synonyms
London
is museums and galleries which got 22%. Next, the second-year Use synonyms
survey
shows Use synonyms
nightlife
and transport as the most uninteresting sectors in Use synonyms
London
which were chosen by 20% of people. Use synonyms
Last
, the third-year Linking Words
survey
, depicted the lowest value was Use synonyms
nightlife
which got only 22%.
If it's looked from the average value the first place of the interesting factor was taken by the range of shops, which was followed by job opportunities, a mixture of people, museums & art galleries, and the Use synonyms
last
place is Linking Words
nightlife
and transport which their average value is 23%.Use synonyms