
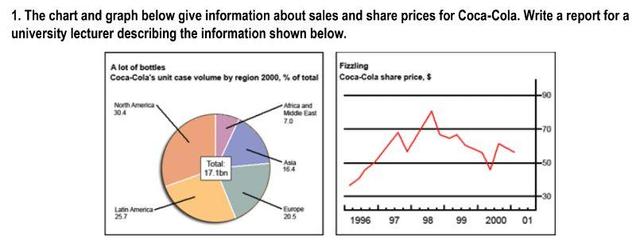
The pie chart shows
total
sales of Coca-Cola in Correct article usage
the total
the
five different areas (North Correct article usage
apply
America
, Latin Use synonyms
America
, Europe, Asia, Africa and Use synonyms
Middle
East). Correct article usage
the Middle
In addition
, the line graph illustrates Linking Words
Use synonyms
share
Correct article usage
the share
price
trend of Coca-Cola from 1996 to 2001. The sales data Use synonyms
presented
in Add a missing verb
is presented
percetages
, Correct your spelling
percentages
percentage
while
Linking Words
Use synonyms
share
Change the verb form
sharing
price
data Use synonyms
in
dollars ($).
In general, North Add a missing verb
is in
America
showed the biggest quantity of total sales, Use synonyms
while
Africa and Linking Words
Middle
East Correct article usage
the Middle
was
the lowest. Correct subject-verb agreement
were
Furthermore
, from 1996 to 2001, the company showed a Linking Words
fluctuative
trend in the Correct your spelling
fluctuating
fluctuation
share
Use synonyms
price
with the highest Use synonyms
price
Use synonyms
was
Wrong verb form
being
on
1998.
North Change preposition
in
America
had the biggest Use synonyms
sale
with Fix the agreement mistake
sales
total
percentage of 30.4%, followed by Latin Add an article
the total
a total
America
and Europe with total percentages of 25.7% and 20.5% Use synonyms
perspectively
. Replace the word
respectively
Conversely
, Africa and Linking Words
Middle
East had the lowest quantity of Correct article usage
the Middle
sale
with Fix the agreement mistake
sales
the
percentage of 7%.
Correct article usage
a
Furthermore
, the line graph showed Linking Words
Correct article usage
a fluctuative
fluctuative
trend Correct your spelling
fluctuating
of
Change preposition
in
Use synonyms
share's
Change noun form
share
price
from 1996 to 2001 with the highest peak of around $80 Use synonyms
on
1998, Change preposition
in
while
the lowest Linking Words
price
was Use synonyms
on
1996 with Change preposition
in
total
of $35. Add an article
a total
Overall
, Linking Words
share
Use synonyms
price
showed an increase from $35 in 1996 to $60 in 2021.Use synonyms