
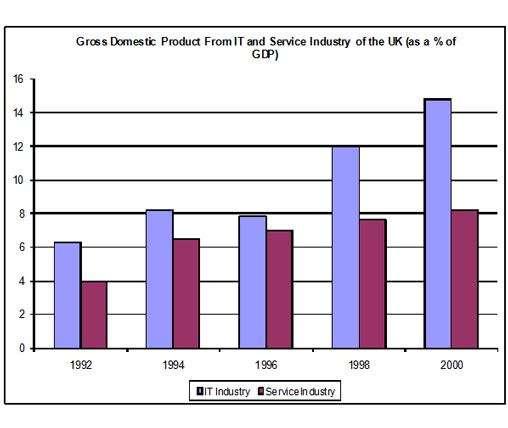
The bar graph illustrates the information on
GDP
in the Western Cape from 1992 to 2000. The units were measured in percentage every year and the category was divided into the IT Use synonyms
industry
and science Use synonyms
industry
.
Use synonyms
Overall
, it can clearly seen that the the Linking Words
GDP
of IT Use synonyms
industry
grew significantly, Use synonyms
whereas
the science Linking Words
industry
was relatively at a slower pace throughout the given period.
In terms of the IT Use synonyms
industry
Use synonyms
GDP
, in 1992 the figure began at just above 6%. After increasing by around 2% in 1994, it experienced a slight Use synonyms
dropped
in 1996 to just under 8. In the following year, the number doubled from the initial year and kept growing Replace the word
drop
at the end
of the period to nearly 15%.
Regarding the science Linking Words
industry
, the Use synonyms
GDP
Use synonyms
was
not increased aggressively like the IT Verb problem
has
industry
. The Use synonyms
GDP
stood at exactly 4% in 1992 and went up to 6.2% in 1994. Use synonyms
Subsequently
, the Linking Words
GDP
rate rose slightly and finished at just above 8% in 2000, the figure was almost half that of the IT Use synonyms
industry
.Use synonyms