
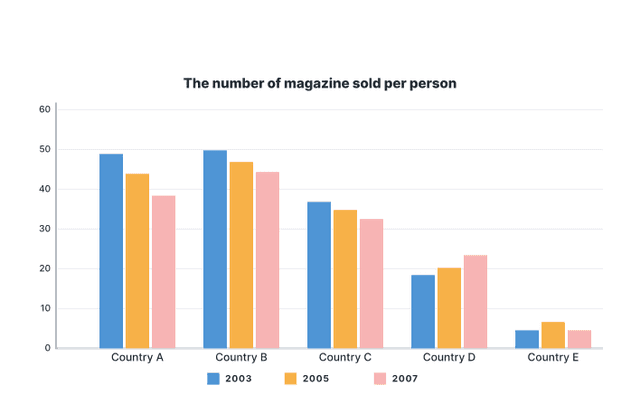
The bar graph depicts the amount of magazines traded per person in five different countries in 2003 and 2005 and projected trade for 2007.
Overall
, except Linking Words
country
D all the nations decrease their sale of brochures in a time period. And nation B somehow managed their sale in 2003 and 2007.
Use synonyms
To begin
with, Linking Words
country
A had a sale of 48 Use synonyms
journals
in 2003 followed by 45 per person in 2005 and expected 38 per individual in 2007. Where Use synonyms
country
B sold 50 and 48 publications per customer in the years 2003 and 2005 respectively and the assumption in 2007 was 45 Use synonyms
journals
per customer. The same trend follows for Use synonyms
country
C the graph dropping from 38 in 2003 to 35 magazines in 2005 followed by 32 per person in 2007.
Use synonyms
Secondly
, for Linking Words
country
D the indicators are increasing from 18 publications in 2003 to 20 in 2005 and 22 Use synonyms
journals
per individual are expected in 2007. Use synonyms
On the other hand
Linking Words
country
E in 2003 and 2007 acquired the same position with 5 publications per human and the indicator picked the hike in 2005 with 7 per human who bought Use synonyms
journals
.Use synonyms