
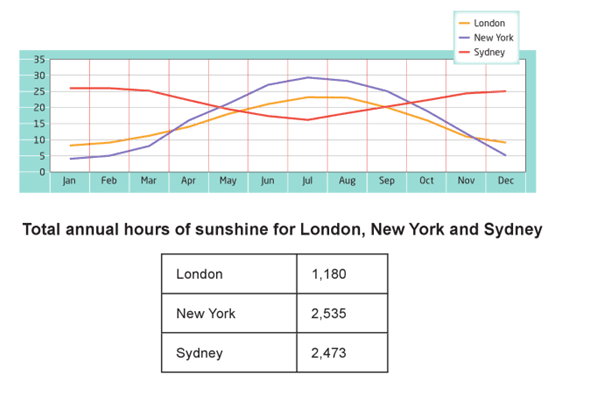
The two charts illustrate information on three prominent cities, including London, New York, and Sydney. The line chart indicates average monthly temperatures
while
the table chart shows the total sunshine per year in Linking Words
hours
.
New York placed first with the highest total emergence of sun up to 2,535 Use synonyms
hours
in 12 months. It reaches its peak in July, and after that, it experiences a steady fall until December. Use synonyms
Next,
there is Sydney with a total of 2,473 Linking Words
hours
of sunshine per year and it peaks in January at over 25 Celcius. Use synonyms
However
, July becomes the month where it has a sharp drop to slightly over 15 Celcius. Linking Words
Finally
, at the bottom, there is London with below 2,000 Linking Words
hours
of sunshine per year, approximately just a mere 1,180 Use synonyms
hours
.
Use synonyms
Overall
, each major cities have its own peak and lowest time when it comes to temperature. Linking Words
Nonetheless
, one huge difference is Sydney peaked in January, Linking Words
while
the other two had their lowest in the same month.Linking Words