
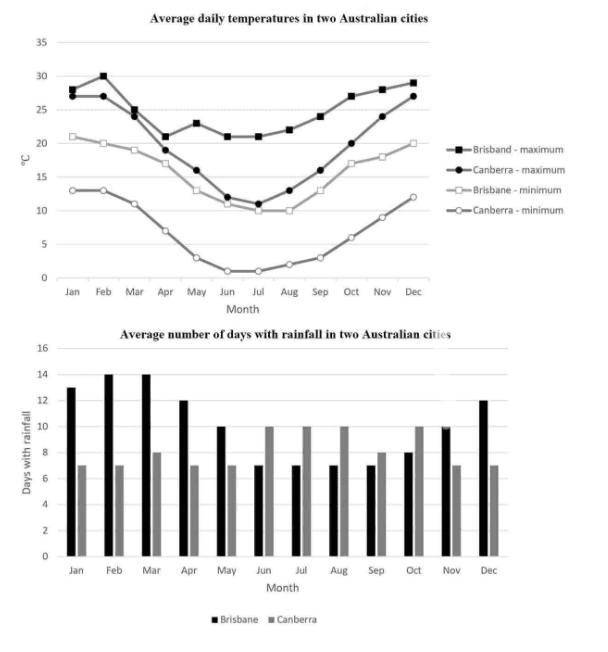
THE LINE GRAPH ILLUSTRATES HOW THE
TEMPERATURES
CHANGE BY THE MONTH IN TWO AUSTRALIAN Use synonyms
CITIES
. THE BAR CHART DEMONSTRATES THE AVERAGE NUMBER OF Use synonyms
DAYS
WITH Use synonyms
RAINFALL
IN TWO AUSTRALIAN Use synonyms
CITIES
IN A YEAR.
Use synonyms
OVERALL
, IN THE MIDDLE MONTHS OF THE YEAR, Linking Words
TEMPERATURES
ARE LOWER THAN EARLIER AND Use synonyms
LAST
MONTHS OF THE YEAR IN Linking Words
BOTH
Use synonyms
CITIES
. Use synonyms
IN ADDITION
, THE NUMBER OF Linking Words
DAYS
WITH Use synonyms
RAINFALL
IS THE HIGHEST IN Use synonyms
BRISBANE
EXCEPT FROM JUNE TO SEPTEMBER WHEN Use synonyms
CANBERRA
ACCOUNTED FOR MORE Use synonyms
RAINFALL
Use synonyms
DAYS
.
AVERAGE DAILY Use synonyms
TEMPERATURES
ARE EXPERIENCED IN FEBRUARY WHEN Use synonyms
BOTH
MINIMUM AND MAXIMUM ARE TOPMOST IN Use synonyms
BOTH
Use synonyms
CITIES
. Use synonyms
CANBERRA
COMPRISES FOR AT LEAST 14 Use synonyms
DAYS
AND MAXIMUM OF 27 Use synonyms
DAYS
, Use synonyms
WHILE
Linking Words
BRISBANE
ACCOUNTS BETWEEN 20-30 Use synonyms
DAYS
Use synonyms
ACCORDING TO
THE MINIMUM AND MAXIMUM DAILY Linking Words
TEMPERATURES
. Use synonyms
FURTHERMORE
, Linking Words
BOTH
BRISBAND AND Use synonyms
CANBERRA
EXHIBIT DROPS UNTIL AUGUST AND IN AUGUST, THE MAXIMUM AND MINIMUM TEMPERATURE OF BRISBAND DECLINE FROM 30 TO 23 AND 21 TO 10 DEGREES; Use synonyms
HOWEVER
, THE MINIMUM TEMPERATURE OF Linking Words
BRISBANE
IS EXTREMELY CLOSE TO 0, AND Use synonyms
NONETHELESS
MAXIMUM CAN BE AROUND 10 DEGREE.
REGARDING THE BAR GRAPH, IN MOST OF THE MONTHS, Linking Words
BRISBANE
INDICATES MORE Use synonyms
DAYS
WITH Use synonyms
RAINFALL
COMPARED TO Use synonyms
CANBERRA
. IN FEBRUARY AND MARCH, Use synonyms
BRISBANE
SHOWS AN UPWARD TREND AND REACHES A PEAK WITHIN 14 Use synonyms
DAYS
. Use synonyms
BY CONTRAST
, FROM JUNE TO SEPTEMBER, Linking Words
CANBERRA
ACCOUNTED FOR THE SUPREME WITH 10 Use synonyms
DAYS
OF THE MONTH.Use synonyms