
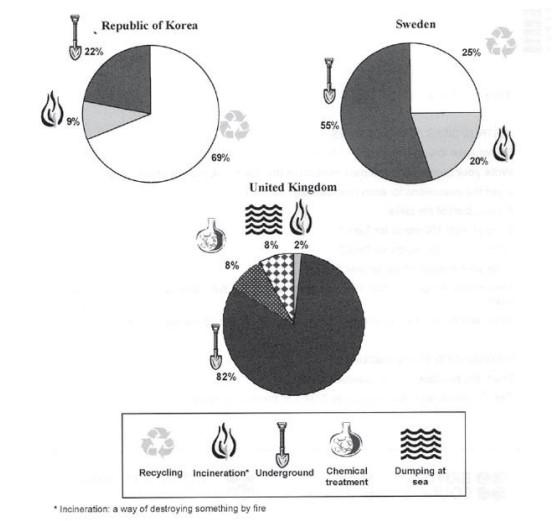
The pie charts illustrate the treatment of
waste
Use synonyms
products
in three different Use synonyms
countries
, namely, the Republic of Use synonyms
Korea
, Sweden and the United Kingdom.It is clear from the graph that , Use synonyms
waste
Use synonyms
products
are managed in five different ways, with recycling and burying underground being the most preferred method in some of the Use synonyms
countries
.
Use synonyms
According to
what is shown, In Linking Words
Korea
, 69% of Use synonyms
waste
Use synonyms
products
are recycled, Use synonyms
in contrast
, the Linking Words
UK
does not Use synonyms
waste
Use synonyms
products
but Sweden recycles more than one-third of Use synonyms
Korea
's Use synonyms
rate
. All Use synonyms
countries
bury some of their Use synonyms
waste
Use synonyms
products
underground, with the Use synonyms
UK
recording the highest Use synonyms
rate
at a wildly 82% against Sweden's Use synonyms
rate
of 55%. Use synonyms
Korea
recorded a figure of 9% which is almost one-ninth of the Use synonyms
UK
's Use synonyms
rate
.
Use synonyms
To sum up
, we could say that, the Linking Words
UK
treats some of its garbage by using chemical treatment or dumping at sea, a practice Use synonyms
that is
not applied to the treatment of refuse in the two other Linking Words
countries
.Use synonyms