
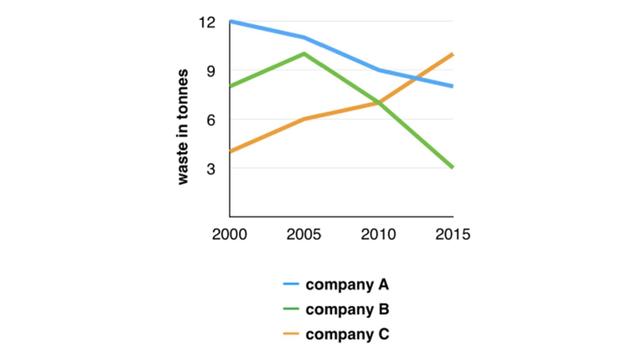
The line graph illustrates, the amount of trash generated in
tonnes
, by three companies over the span of 15 years, starting from 2000 to 2015. Use synonyms
It is clear that
Linking Words
,
Remove the comma
apply
Company
C has contributed the highest Use synonyms
tonnes
of waste, Use synonyms
whereas
Linking Words
Company
B's garbage generation has plummeted over the years.
To start with the eye-catcher, Use synonyms
Company
B, has shown a drastic reverse in the accumulation of debris over the years, precisely, a downward graph which started with 8 Use synonyms
tonnes
in 2000, fell to 3 Use synonyms
tonnes
in 2015, even though it had fluctuated between 2005, reaching 10 Use synonyms
tonnes
. Use synonyms
Company
A has Use synonyms
also
shown a similar style, which opened with 12 Linking Words
tonnes
in the year 2000 and terminated with 8 Use synonyms
tonnes
in 2015.
Use synonyms
In contrast
, Linking Words
Company
C started with 4 Use synonyms
tonnes
in 2000 but steadily Use synonyms
stepped-up
to reach 10 Correct your spelling
stepped up
tonnes
in 2015, Use synonyms
to
becoming the highest rubbish producer.Change preposition
apply