
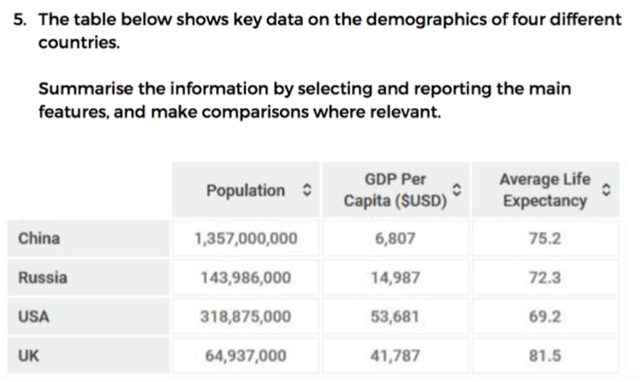
The table compares four different countries in terms of population,
GDP
per capita and average life expectancy.
Use synonyms
Overall
, the most populous nation is Linking Words
China
, but Use synonyms
this
country has the lowest Linking Words
GDP
per person, Use synonyms
while
the US has the highest economic output per capita, but the lowest life expectancy.
As can be seen from the table, Linking Words
China
has a total population of over 1.3 billion, followed by the US with the figure being significantly lower, at nearly 319 million. The population in the UK is the lowest, at only around 65 million, half the figure of Russia. In terms of Use synonyms
GDP
per capita, the US has the largest number, at nearly $54,000, Use synonyms
while
the lowest figure is recorded in Linking Words
China
, just about $6,800. Use synonyms
GDP
per person in the UK is approximately $41,800, almost double that of Russia.
Use synonyms
According to
the table, Linking Words
life
expectancy, on average, of people in the UK is highest, at 81.5 years, Correct article usage
the life
while
that of Americans is lowest only 69.2 years. The figures for Linking Words
China
and Russia are 75.2 and 72.3 years respectively.Use synonyms