
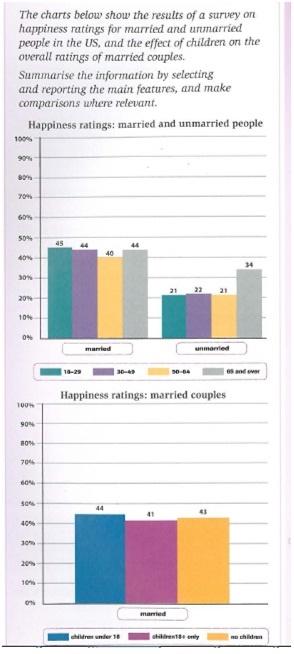
It can be seen that there are two charts about how happy
people
are when they are married and single Use synonyms
as well as
the happiness ratings of the Linking Words
children
of Use synonyms
people
who are married in the USA. The graph compares the levels of happiness of Use synonyms
people
at different ages. (represented by colours??I don't know if it would be necessary)
Use synonyms
According to
the graph married are happier than unmarried Linking Words
people
. It can be observed in the category married the Use synonyms
group
happiest are between Use synonyms
ages
of 18 and 29 with 45 Correct article usage
the ages
Use synonyms
percent
Change the spelling
per cent
while
the 55 to 64 age Linking Words
group
represents the unhappiest category.
Use synonyms
In contrast
, the largest Linking Words
group
of happy singles are over the age of 65 represented by 34 Use synonyms
Use synonyms
percent
, Change the spelling
per cent
subsequently
, Linking Words
people
between the ages of 30 and 49 make up the Use synonyms
second
happiest Linking Words
group
by 22 Use synonyms
Use synonyms
percent
.
The Change the spelling
per cent
second
chart demonstrates an interesting rating the Linking Words
children
´s couple have similar amounts of happiness. The happiest Use synonyms
children
are represented for the Use synonyms
group
under 18-year-old Use synonyms
with
44 Change preposition
at
Use synonyms
percent
and other groups with a similar percentage, adults Change the spelling
per cent
by
43 Change preposition
at
Use synonyms
percent
and Change the spelling
per cent
children
Use synonyms
with
18 years old Change preposition
at
41
Change preposition
at 41
Use synonyms
percent
.
Change the spelling
per cent
Overall
is clear that married Linking Words
people
are happiest arriving Use synonyms
almost
double of percentage compare with singles Change preposition
at almost
as a consequence
their Linking Words
children
are happy as well Use synonyms
with
Change preposition
at
the
similar rate.Correct article usage
a