
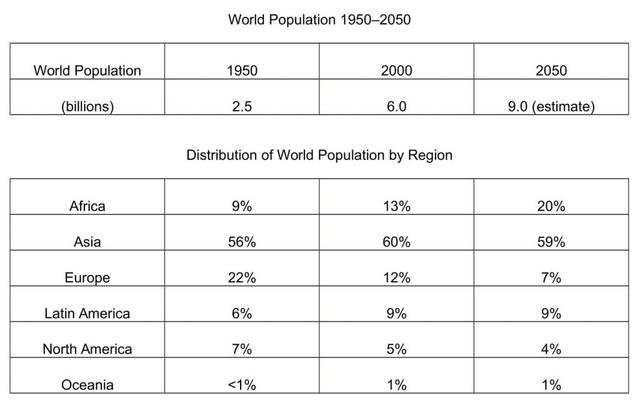
The table shows the absolute number of the world
population
for the years 1950, Use synonyms
2000
and the projected estimate for the year 2050. It Correct word choice
and 2000
also
reports the percentage Linking Words
distribution
by continent for the same years.
Use synonyms
Overall
, the global Linking Words
population
has increased more than twofold from 1950 to 2000 and is forecasted to Use synonyms
further
rise by the year 2050. Linking Words
In addition
, the Linking Words
overall
Linking Words
distribution
will slightly change with Asia hosting more than Use synonyms
one half
of the total Add a hyphen
one-half
population
, Use synonyms
whereas
Europe is expected to contain less than one-tenth of it.
The world Linking Words
population
Use synonyms
has
presented a strong increase between 1950 and 2000, rising from 2.5 billion people to 6.0 billion. Unnecessary verb
apply
This
raise is estimated to proceed at a slower pace in the Linking Words
next
50 years when the total number is predicted to reach 9.0 billion. In terms of Linking Words
distribution
, Use synonyms
few
interesting changes are to be witnessed. First, the proportion of people living in Africa will increase from 9% in 1950 to 20% in 2050, Correct article usage
a few
thus
confirming the increasing trend revealed in 2000, when the Linking Words
distribution
for Use synonyms
this
continent reached 13%. Asia has always hosted more than 50% of the world’s inhabitants, presenting only a few slender changes, ranging from 56% in 1950 to 59% in 2050. Europe’s Linking Words
distribution
has been the most impacted, dropping from more than one-fifth of the total count to 12% in 2000. Use synonyms
In addition
, Linking Words
this
downward trend is expected to continue with a predicted Linking Words
distribution
of 7% in 2050.
In conclusion, Latin and North America will keep the same demographic pace, whit the former, starting from 6% in 1950, stable Use synonyms
around
9% both in 2000 and 2050, and the latter hosting around 5% of the world’s citizens throughout the whole timespan. Change preposition
at around
Lastly
, Oceania has had and will maintain the same Linking Words
population
fraction of almost 1%.Use synonyms