
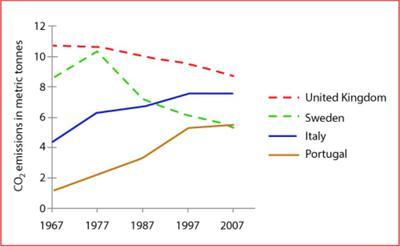
The line graph provides information about the carbon dioxide (CO2) emissions
in
average per person in three different countries (United Kingdom, Change preposition
on
Sweden
, Italy, and Portugal) from 1967 to 2007. Use synonyms
Overall
, the Linking Words
number
in Italy and Portugal maintained Use synonyms
increase
Correct article usage
an increase
while
in UK and Linking Words
Sweden
experienced Use synonyms
decrease
.
At the beginning of the period, the United Kingdom and Add an article
a decrease
Sweden
became the most nation contributing C02 emissions which were just over 10 Use synonyms
tonnes
for the former and around 9 Use synonyms
tonnes
for the latter. Use synonyms
Then
, in 1977, there was a slight decrease in the UK and the Linking Words
number
kept decreasing until 2007 which was approximately 9 Use synonyms
tonnes
. Meanwhile, there was a significant increase in Use synonyms
Sweden
by about 2 Use synonyms
tonnes
in 1977 and a dramatic decrease at 7 Use synonyms
tonnes
. The Use synonyms
number
kept falling to just below 6 Use synonyms
tonnes
Use synonyms
at the end
of the period.
Linking Words
On the other hand
, in Italy and Portugal, Linking Words
although
being the lowest Linking Words
number
of contributing gas emissions in 1967, the figures kept raising until the end of the period. The Use synonyms
number
jumped by around 4 Use synonyms
tonnes
for each state.Use synonyms