
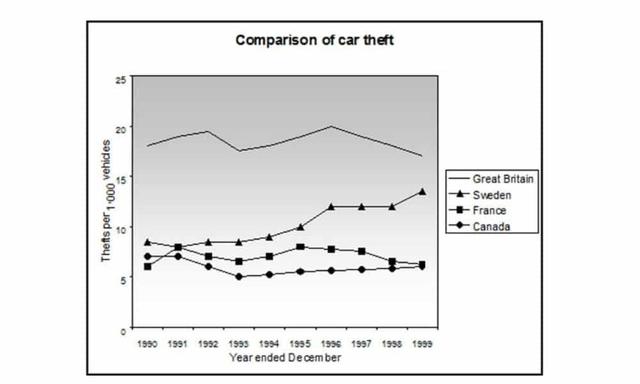
The chart illustrates the number of vehicles per thousand stolen by thieves in four different countries from 1990 to 1999.
Overall
, despite some fluctuations, there was a stable tendency in the cases of car thefts in the UK, Canada, and France, Linking Words
while
Sweden saw a consistent rise throughout the period given. Linking Words
Additionally
, the UK consistently had the highest figures.
In 1990, there were around 17 Linking Words
million
stolen vehicles in the UK, after which it fluctuated between 16 Use synonyms
million
and 20 Use synonyms
million
until 1997, before dropping back to its initial point in 1999. Use synonyms
Conversely
but to a lower extent, the figure for Sweden accounted for approximately 8 Linking Words
million
cases, followed by a progressive increase to around 12 Use synonyms
million
ones in 1996, it later remained unchanged until 1998, and Use synonyms
finally
increased to reach nearly 15 Linking Words
million
in just 1 year later.
In terms of the two remaining nations, Canadian thieves stole above 5 Use synonyms
million
cars at the beginning, with a gradual decrease to exactly 5 Use synonyms
million
in 1994, next it hovered mildly around that number, and a final rise to 5.5 Use synonyms
million
in 1999. Use synonyms
Similarly
, the number of French vehicles decreased to 5 Linking Words
million
in 1993Use synonyms
,
but later rose back to more than 5 Remove the comma
apply
million
in the final year.Use synonyms