
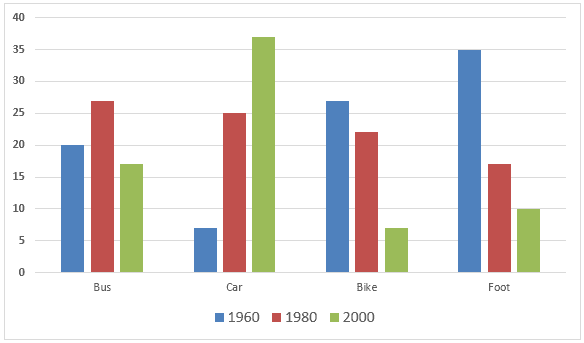
The bar chart below gives information about what
people
used to commute from and to their workplace in a certain city in Europe for 40 years. Generally, the preferable mode of Use synonyms
transportation
was changed every 20 years.
At the beginning of the period which is 1960, most Use synonyms
people
use the bus as the main Use synonyms
transportation
to travel to and from work almost 40% of the population. Use synonyms
On the other hand
, the car is the least Linking Words
transportation
used by Use synonyms
people
with only 7% of its population.
In the following 20 years, around 28% of the Use synonyms
people
chose to train and bus as their favourite vehicle to move from and to their workplace. In the latest year from the periods, car users rose dramatically to 37,5% Use synonyms
people
and being the most preferable Use synonyms
transportation
to commuting to and from their office. Use synonyms
On the other hand
, the bus is the Linking Words
transportation
with the least users in the year 2000 with only 15%.Use synonyms