
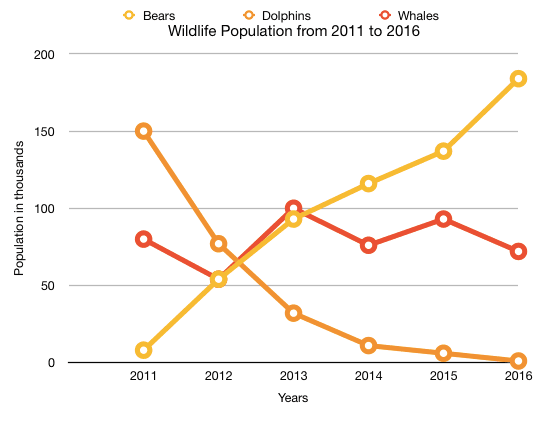
The given line graph illustrates the population of various animal types within a
period
of 6 years-commencing from 1977. Use synonyms
Overall
the Linking Words
number
of dolphins declined over the Use synonyms
period
. Use synonyms
Whereas
there was an increase in the Linking Words
number
of bears.
At the beginning of the Use synonyms
period
, dolphins which was been 150 Use synonyms
thousand
, Use synonyms
was
the most populous animal. Correct subject-verb agreement
were
This
was higher than others. Linking Words
However
, it declined gradually or the 6 years timescale to finish at just zero. In sharp contrast to Linking Words
this
, Linking Words
firstly
the Linking Words
number
of bears was almost 5 Use synonyms
thousand
. The figures rose dramatically and exceeded that of whales in 2013 with a Use synonyms
number
of 100 Use synonyms
thousand
. After that, there was a fast rise to get to around 200 Use synonyms
thousand
.
Whales began at almost 80 Use synonyms
thousand
and after 3 years surprisingly reached 100 Use synonyms
thousand
in 2013. For the next 3 years population of whales declined to roughly 60 Use synonyms
thousand
in the rate of bears climbed significantly during the Use synonyms
period
.Use synonyms