
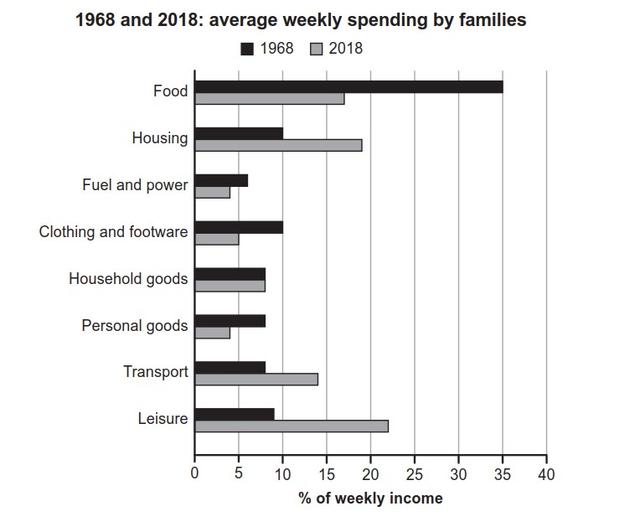
The bar chart illustrates the percentage of income families spent on a weekly basis from the year 1968 to the year 2018 in a particular country.
transport was at the moderate level of 14%
Overall
, it is noticeable that the level of spending on food is ranked the highest in 1968, Linking Words
while
in 2018, most families paid for leisure activities. Linking Words
Whereas
, the lowest payment went to fuel and power. Linking Words
In addition
, the percentage of weekly income for household products was identical to 7% for both years
In 1968, almost all categories are in a similar rate of spending roughly 15%, except food which is counted for 35%. Household stuff, personal goods, and transport were in the same amount of approximately 8% weekly.
With regard to the period of 2018, The level of spending is varied. The top three categories are leisure, housing, and food with 22%, 18%, and 16%, respectively. Linking Words
In contrast
, the lowest rate of weekly earnings for Linking Words
this
year were fuel power and personal goods which counted for 4%. Linking Words
Lastly
,Linking Words
Add an article
the