
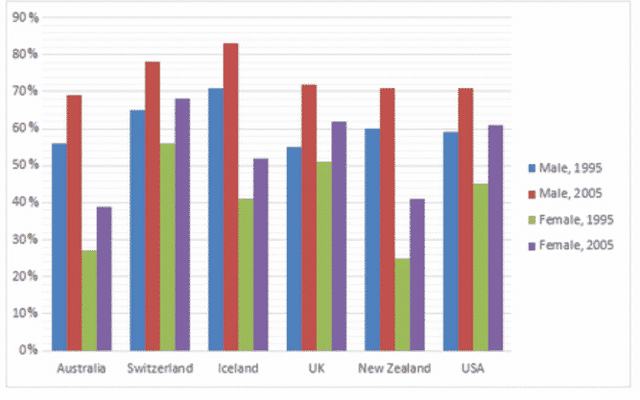
The following graph indicates data about
employment
rates of the two genders in six different countries between 1995 and 2005. Use synonyms
Overall
in Australia, Iceland and New Zealand male hiring differs considerably from Linking Words
females
in both years.
Fix the agreement mistake
female
According to
the bar ,Linking Words
chart
we can see that the highest male Add an article
the chart
employment
number is in Iceland and it is around seventy per Use synonyms
cent
. ,Use synonyms
However
in ,2005 it rose to over eighty per Linking Words
cent
. Use synonyms
Also
if we look at women's recruitment in the year 2005 we are able to find that it was above forty per Linking Words
cent
and after another ten ,years it didn't change a lot only to ten per Use synonyms
cent
.
Use synonyms
While
in the USA the situation was completely different. Linking Words
For instance
, back in 1995 female Linking Words
employment
was near to forty per Use synonyms
cent
and Use synonyms
it is clear that
now it rose to sixty per Linking Words
cent
. Use synonyms
On the other
Linking Words
hand
male community experienced only half of the growth of females, by 10% from 60 to 70%.
In conclusion, Add a comma
,hand
although
men's Linking Words
employment
was higher than women's, it didn't face Use synonyms
such
a rise as females.Linking Words