
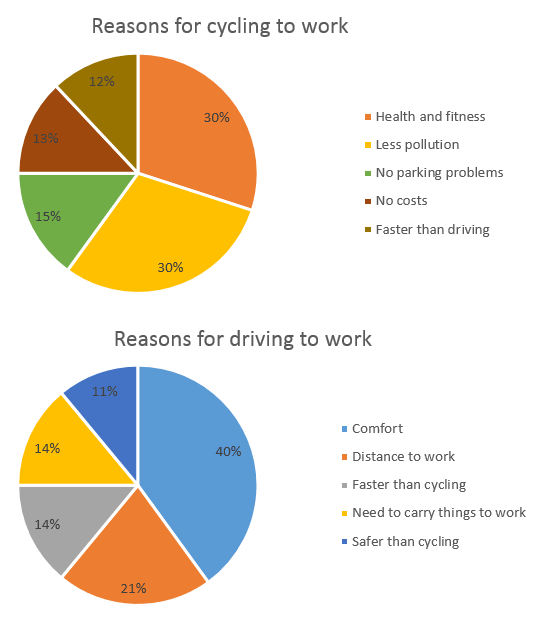
The pictures illustrate information about the
reasons
why people choose to cycle or drive to Use synonyms
work
. Units are measured by Use synonyms
percentage
.
As can be seen from the pie charts, health and fitness and Use synonyms
also
less pollution are responsible for the main factors of people who choose cycling to Linking Words
work
. Use synonyms
Moreover
, the most significant Linking Words
percentage
of driving to Use synonyms
work
is allocated to comfort. Use synonyms
In particular
, almost the same Linking Words
percentage
of people prefer cycling or driving because of their speed.
The most significant proportion of Use synonyms
reasons
for driving to Use synonyms
work
, 40%, is used for comfort. Followed by distance to Use synonyms
work
which accounts for 18% less. Use synonyms
Additionally
, the lowest Linking Words
percentage
of Use synonyms
reasons
belongs to safer than cycling which is 11%.
Use synonyms
On the other hand
, health and fitness and Linking Words
also
less pollution are responsible for the largest number of Linking Words
reasons
for cycling to Use synonyms
work
at 30%. The other reason Use synonyms
that is
no parking problems allocated 15% which is twice less than less pollution and health and fitness. The figure for faster than driving is 12% and there is no significant difference between the figure for driving to Linking Words
work
which is 11%.Use synonyms