
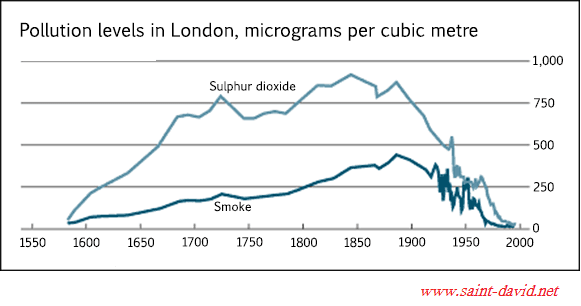
Given is a line graph illustrating the level of
sulphur
dioxide and Use synonyms
Smoke
per cubic metre in London from 1600 to 2000. Use synonyms
Overall
, the amounts of Linking Words
Sulphur
dioxide were at least two times as high as those of Use synonyms
Smoke
over the provided period.
Use synonyms
Similarly
, both of them constituted the same degree in the initial year, nearly 10 units. Linking Words
However
, Linking Words
Linking Words
while
the amounts of Correct word choice
apply
Smoke
increased marginally until the end of the 18th reaching the plateau at just under 500 micrograms, with a profound drop in the second half of the Use synonyms
17th century
Add a hyphen
17th-century
Sulphur
dioxide jumped rapidly through these Use synonyms
years
and by 1900 it consisted of two times more in the air than the first one.
In the Use synonyms
years
that followed, their figures declined dramatically Use synonyms
especially
Add the comma(s)
,especially
Sulphur
dioxides. Its level, in the next four decades, roughly halved to 500 micrograms and started to fluctuate, whilst Use synonyms
Smoke
began it ten Use synonyms
years
ago. These profound fluctuations continued for the next 30 Use synonyms
years
comprising a negative trend. Currently, their degree is as many as it used to be in the starting year.Use synonyms