
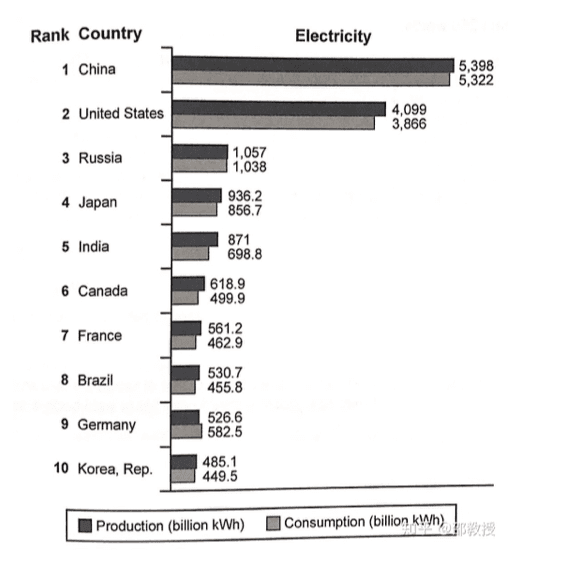
The graph provides information about, how much electric power was generated and its usage throughout 2014 in the main ten states.
Overall
, there was a downward trend in production and consumption in all countries. The generation of electricity did not overcome expenditure except in Germany. And Linking Words
also
China stood at the highest level Linking Words
while
Korea was at the lowest.
Linking Words
According to
the data, China takes over the highest range of the graph and the manufacturing and usage of electricity were 5398 and 5322 respectively in billion kWh. A dramatic increase in remaining power was figured by the United States and it was nearly 200 billion kWh. Linking Words
Moreover
, it was the largest amount when compared with all nations. Russia had the least continuation of power and it was approximately 20 in relevant units. Linking Words
Furthermore
, the consumption of electricity overcomes the number of production in Germany these were respectively 526.6 and 582.5 in billion kWh.Linking Words