
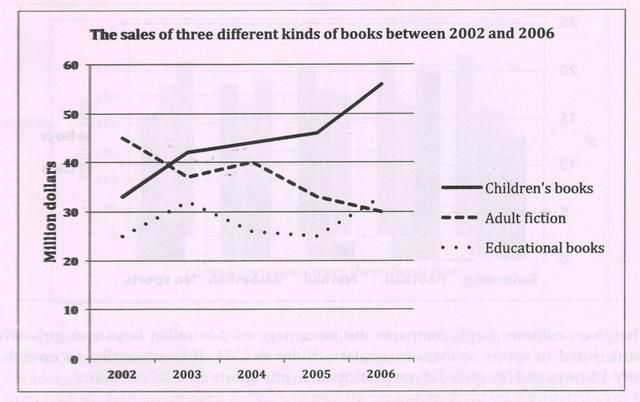
The line graph depicts the income made between 2002 and 2006, coming from the sales of books for children, adult storybooks, and books with an educational purpose.
Overall
, it can be seen that educational books and children's volumes experienced decreases, Linking Words
whereas
only the adult category narrative went down.
Titles of children's interest first brought around 10 Linking Words
million
dollars in late 2003 and Use synonyms
then
Linking Words
levelle
off through the next two years until it jumped from approximately 45 Correct your spelling
levelled
million
to nearly 55 Use synonyms
million
in sales in 2006. At the same time, educational publications' revenues experienced a quite similar climb, and, Use synonyms
although
following that there was a two-year slight decline, it ended, in 2006, with a turnover of roughly 7 Linking Words
million
dollars more than the initial one.
Use synonyms
On the other hand
, adult novels' wholesale started falling from their maximum in 2002 down under 40 Linking Words
million
dollars, and after a brief recovery in 2004, it followed a constant downward trend that led to end with a similar final income to the one with which educational publications terminated.Use synonyms