
This
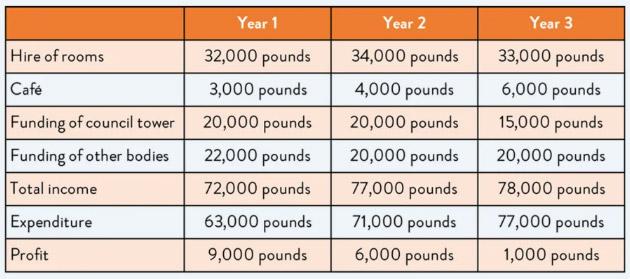
table represents information about the profits and spending of Brooklyn Hall in three different years.
Linking Words
Overall
, Linking Words
it is clear that
there are 4 different categories of services in a hall that contribute to spending.
Linking Words
According to
the data, the hire of rooms was the most expensive tool, in the first year it was 32000 pounds Linking Words
then
it rose to 34,000 but it was followed by a slight decline in the next year, Linking Words
whereas
the cafe was the least expensive entertainment on the first term it was 3000 pounds after that it increased by 1000 and Linking Words
lastly
it doubled its original price.
Linking Words
Secondly
, Linking Words
although
funding for the council tower was stable throughout the first two periods at 20.000 it witnessed a decrease to 15.000 Linking Words
at the end
of the period. Linking Words
On the other hand
funding of the bodies started at 22.000 Linking Words
then
it followed a marginal dip by 2.000 and was constant for another two terms.
Linking Words
Finally
, Linking Words
while
total income experienced an upward trend so did expenditures and profit was sufferingLinking Words