
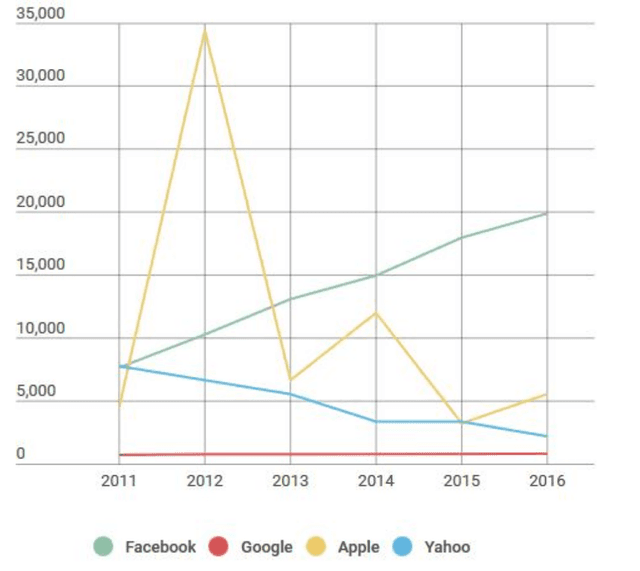
The bar chart provides data on the
stock
rate of Facebook, Use synonyms
Apple
, Google and Use synonyms
Yahoo
from 2011 to 2016.
Use synonyms
It is clear that
Facebook and Linking Words
Yahoo
had the highest Use synonyms
stock
prices in the year 2011 (approximately 7500). Use synonyms
Then
these two companies had critically different development: Linking Words
while
the first company's Linking Words
shares
grew steadily during the whole Use synonyms
period
and accounted for 20000 in 2016, Use synonyms
Yahoo
stocks shew a downward trend and the price was only about 2500 Use synonyms
at the end
of the Linking Words
period
.
Probing Use synonyms
further
, Linking Words
Apple
's Use synonyms
shares
Use synonyms
costed
5000 in 2011 and Correct your spelling
cost
then
surged significantly and reached a peak in 2012, of almost 35000. The Linking Words
stock
price of Use synonyms
Apple
dipped in 2013 and fluctuated up to the end of the Use synonyms
period
. The Use synonyms
last
figure made up only approximately 5000. It is remarkable, that the Linking Words
shares
of Google remained stable during the Use synonyms
period
and accounted for about 1000.
Use synonyms
Overall
, the Facebook Linking Words
stock
price shew an upward trend, Use synonyms
Apple
Use synonyms
shares
fluctuated a lot, Use synonyms
Yahoo
stocks almost halved and Google Use synonyms
shares
were stable.Use synonyms