
A glance at the pie chart reveals the one British area of police avenue in terms of four categories and where the money was spent in 2017 and 2018.
Overall
, Linking Words
it is clear that
the least Linking Words
number
of expenditures covered in Use synonyms
xx
in 2017, Use synonyms
whereas
, in 2018, the figure for Linking Words
xx
was at its peak. It Use synonyms
also
can be seen that the aspect of salaries was the highest spend Linking Words
in contrast
to the technology, which was the least opted item.
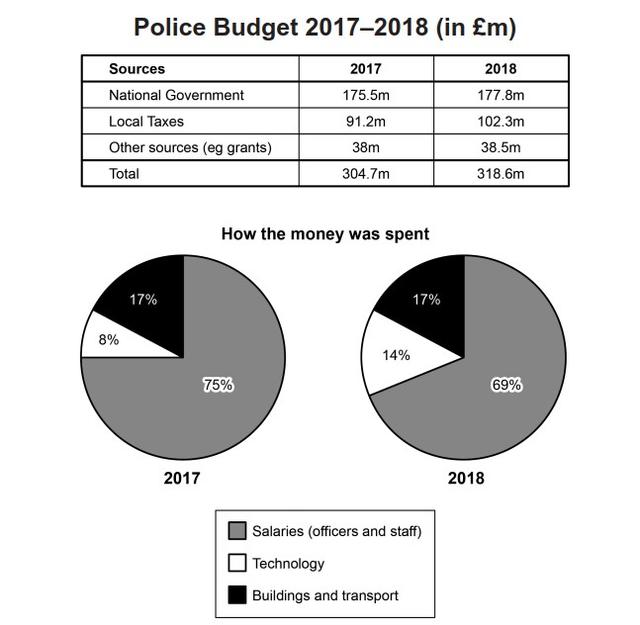
Looking at the first table, in 2017, the national government expenditure was highest, at 175.5m, which was five times higher than that of other sources. By 2018, the national government and other sources shared a similar Linking Words
number
of 177.8m and 38.5m respectively. The local taxes experienced an increase, reaching 102.3m over Use synonyms
this
period, almost rising by 10m.
Turning to the second pie chart, the least percentage of technology was 8% and 14% separately in 2017 and 2018. Linking Words
While
the Linking Words
number
of salaries reached the peak of 75% and 69% in 2017 and 2018, which were Use synonyms
xx
and Use synonyms
xx
higher than that of technology. The buildings and transport shared an equal Use synonyms
number
, which accounted for 17% each.Use synonyms