
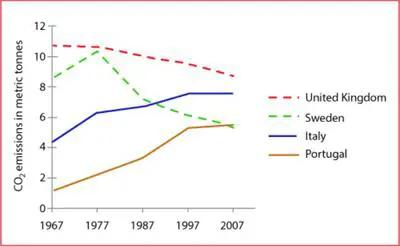
The given data on average carbon dioxide emissions per person between 1967 and 2007 in the United Kingdom (UK), Sweden, Italy and Portugal are depicted in the line graph.
At first glance, the averages of carbon dioxide emission showed not only downward but
also
upward trends. Descending trends were found in UK and Sweden. Meanwhile, Italy and Portugal had an upward tendency.
To be particular, UK emissions started from more than 10 metric Linking Words
tonnes
in 1967 and decreased gradually by about 2% in 2007. Use synonyms
Moreover
, the downward trend Linking Words
also
can be seen in Sweden. The emission average began at about 8 metric Linking Words
tonnes
in 1967, Use synonyms
then
increased by a fifth in 1977 and decreased to under 6 metric Linking Words
tonnes
in 2007.
Use synonyms
On the other hand
, both Italy's and Portugal's emissions improved. Italy was around 4 metric Linking Words
tonnes
and sequentially rose approximately double Use synonyms
at the end
of the period. Linking Words
Similarly
, Portugal had an emission average of just under 2 metric Linking Words
tonnes
in 1967, Use synonyms
then
inclined progressively around threefold after 5 decades.Linking Words