
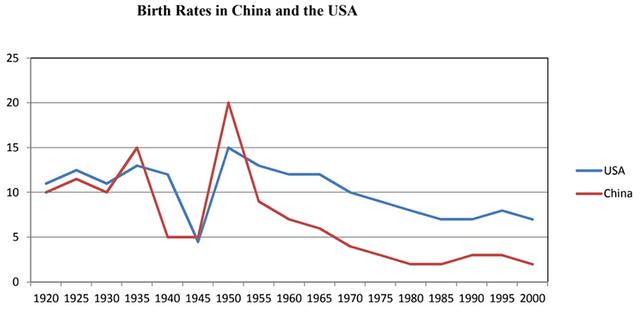
The line graph depicts the average the amount of
rate
of Use synonyms
the
birth between 1920 Correct article usage
apply
and200
in different two countries .It is clear from the graphCorrect your spelling
and 200
Correct word choice
that
Use synonyms
brith
in Correct your spelling
birth
US
continuously dominated in Correct article usage
the US
Correct article usage
a specfic
specfic
period . Correct your spelling
specific
While
the equivalent figure for Linking Words
Use synonyms
Correct article usage
the brith
brith
Correct your spelling
birth
ration
in China ranked the lowest throughout 30 years nearly .
In 1920 the percentage of Correct your spelling
ratio
Use synonyms
brith
Correct your spelling
birth
was
fluctuated with Unnecessary verb
apply
figure
Add an article
a figure
about
10 %, in the following 10 years the Change preposition
of about
rate
of Use synonyms
Use synonyms
brith
Correct your spelling
birth
it
reached Correct pronoun usage
apply
till
15%.Change preposition
apply
In
1935 to 1945 the Change preposition
From
rate
of Use synonyms
Use synonyms
brith
sharply fell to 5%. After 5 years the amount of Correct your spelling
birth
Use synonyms
brith
increased remarkably peaking at approximately 20%. From 1945 Correct your spelling
birth
to2000
the Correct your spelling
to 2000
percent
of birth had decreased from 20%to5%.
In Replace the word
percentage
US
there was a Correct article usage
the US
down trend
Correct your spelling
downtrend
around
5% in 1945. Change preposition
of around
By
Linking Words
contrast
an obvious increment can Add a comma
,contrast
also
be seen from 5% in 1945 to 15% in 1950. Linking Words
Intrestingtly
, Correct your spelling
Interestingly
since
1950 to 2000 the Change preposition
from
rate
of birth saw a clear of downward trend 15 to 1 in order of that.Use synonyms