
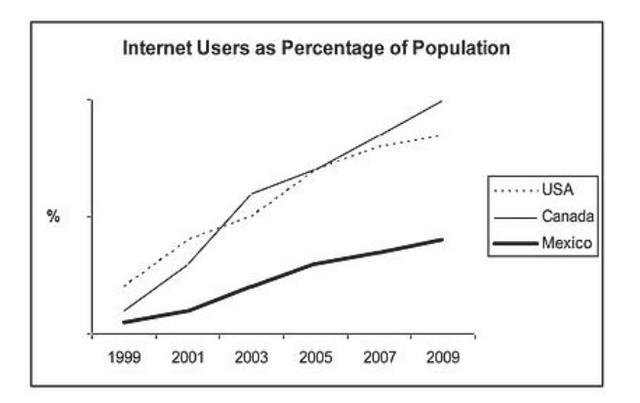
This
diagram represents specific information related to the average of internet users from main numerous countries. Linking Words
In addition
, the limited period from 1999 to 2009 means the population evaluation through the tenth year.
The line chart demonstrates the per cent of consumer's upsurged rate. Linking Words
Furthermore
, there is met point between Linking Words
USA
and Use synonyms
Canada
in 2002 and 2005. Use synonyms
Moreover
, Linking Words
Mexico
's percentage is upward less compared with other countries. Use synonyms
Additionally
, the Linking Words
USA
considered at the top of the uplift ratio reached approximately a hundred per cent and the line moved as waves from 2001 to 2005.Use synonyms
Besides
, the Linking Words
USA
reduce in the year 2003 Use synonyms
then
backs to rise again. Linking Words
Also
, Linking Words
Mexico
stopped at less than half the average and Use synonyms
Canada
at eighty per cent.
To summarize, the data given above illustrates the range of population for internet users in three countries Use synonyms
USA
, Use synonyms
Canada
, and Use synonyms
Mexico
. Use synonyms
Overall
, the number moved on unstable movement and there is no decline for Linking Words
Canada
and Use synonyms
Mexico
.Use synonyms