
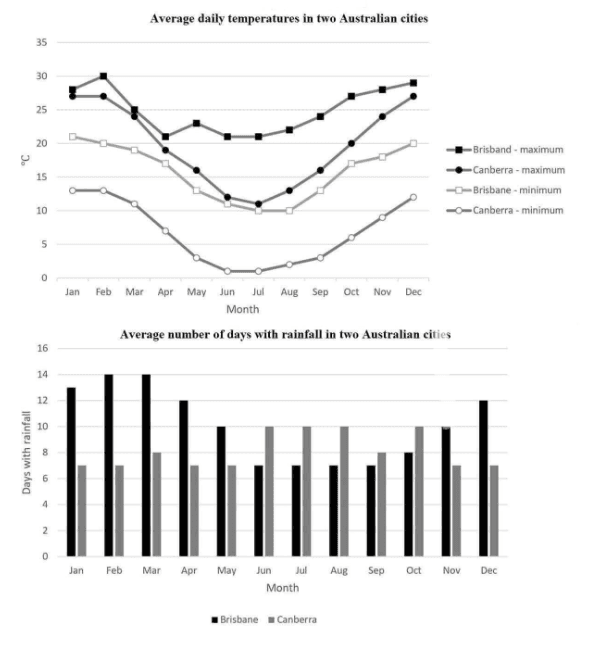
The graph shows the average maximum and minimum temperatures in degree Celsius on a daily basis in
Brisbane
and Use synonyms
Canberra
. The chart Use synonyms
further
provides data about the average number of Linking Words
days
with Use synonyms
rainfall
from January to Use synonyms
December
in Use synonyms
Brisbane
and Use synonyms
Canberra
.
Use synonyms
Overall
, it can be derived from the data that Linking Words
Canberra
is a colder city and has more fluctuations in its temperature throughout the year with its average Use synonyms
rainfall
going up only from June to October. Use synonyms
However
, Linking Words
Brisbane
being the hotter city Use synonyms
also
experiences more Linking Words
rainfall
during most of the months of the year than Use synonyms
Canberra
.
The first chart shows that Use synonyms
Brisbane
and Use synonyms
Canberra
are equally hot during January and Use synonyms
December
with the temperature ranging around 26-30 degrees Celsius. As it starts to cool down from January to May, June to August are the coldest months with a range of 0 to 12 degrees and about 12-20 degrees in Use synonyms
Canberra
and Use synonyms
Brisbane
, respectively. From Use synonyms
then
on, the temperatures start to rise till Linking Words
December
, in both cities.
In the second chart, the highest amount of Use synonyms
rainfall
received is in February and March with an average of 14 Use synonyms
days
. Use synonyms
Furthermore
, it goes down to approximately 7 Linking Words
days
before rising again in Use synonyms
December
. Use synonyms
In contrast
, the maximum Linking Words
rainfall
that Use synonyms
Canberra
receives is from June to August, which is about 10 Use synonyms
days
. Use synonyms
Otherwise
, it is always less than 8 Linking Words
days
during the rest of the months in Use synonyms
Canberra
.Use synonyms