
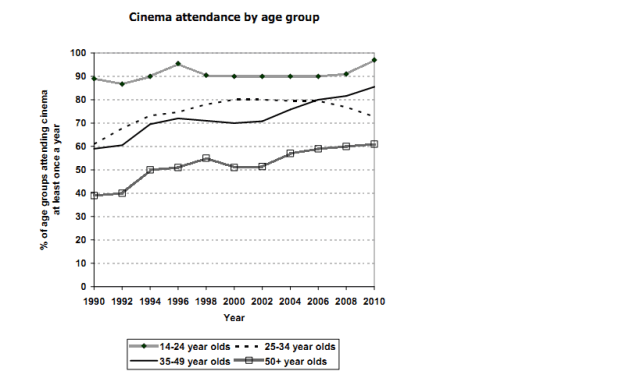
The line graph represents the data on cinema attendance in Australia from 1990 to 2010.
Overall
, it can be seen that 14 to 24 years old members are following an upward trend. Linking Words
Whereas
, the ratio of old age people is decreasing over the period.
Linking Words
Furthermore
, 50 years old members experienced ups and downs till the year 2010. Linking Words
Firstly
, (40•/•) people attended the cinema. After that, it surges to (60•/•) in the year. Linking Words
Moreover
, the 35 to 49 years old generation fluctuates widely. In the year 1992, it remained at (60•/•) but over time it hit the point of (85•/•).
Linking Words
In addition
, adults (25 to 34) experienced a stability period from 2000 to 2006 with (80•/•). Linking Words
Likewise
, members of the (25 to 34) age group show a decline in percentage with (70•/•). Linking Words
Therefore
, the attendance of youngsters (14 to 24) in cinema slightly decreased in 1992 with (85•/•). Linking Words
Whereas
, they stayed constant from 1998 to 2008 at (80•/•) and increased in 2010 at (100•/•).Linking Words