
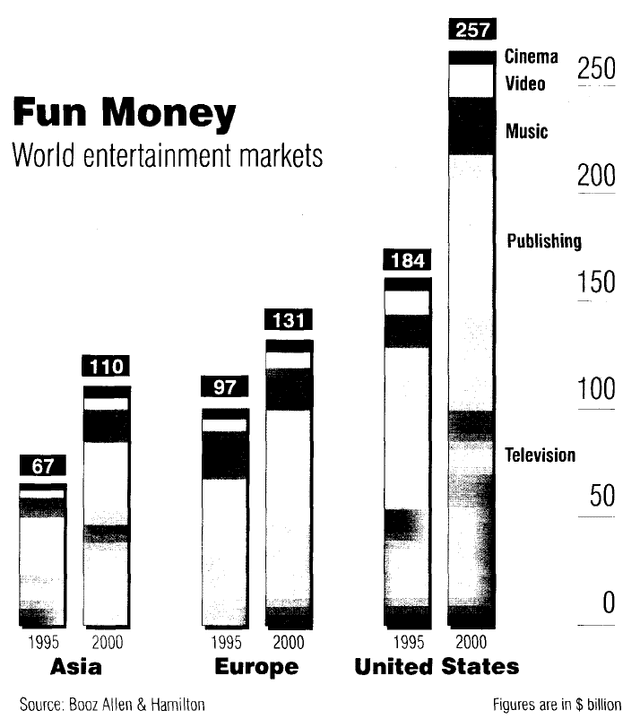
The bar chart illustrates how money is used in a range of
entertainment
between 1995 and 2000.
Use synonyms
Overall
, the United States spent the most funds in both years. Linking Words
Asia
engaged the least in Use synonyms
entertainment
in the entire period.
Publishing was noted to be the most interesting form of Use synonyms
entertainment
in each of the periods in all three continents with about 30 Use synonyms
billion
spent in Use synonyms
Asia
in 1995 and the highest record of about 110 in 2000 used by the United States. Television was obviously the second most engaging fun in Use synonyms
Asia
, Europe and America. It attracted about 20 Use synonyms
billion
in funds in Use synonyms
Asia
in the year 1995 and 40 tons in 2010 in the same continent.
Cinema was the least popular Use synonyms
entertainment
form with the least records in all the years. Use synonyms
Asia
spent 67 Use synonyms
billion
in 1995 and 110 Use synonyms
billion
in 2000 as the total money used in that period. Use synonyms
Additionally
, Europe imbursed 97 Linking Words
billion
in 1995 and 110 Use synonyms
billion
in 2000 as the total amount used during that time. The United States allocated the most money in the five-year period with 184 Use synonyms
billion
and 257 Use synonyms
billion
in 1995 and 2000 respectively.Use synonyms