
The pie
chart
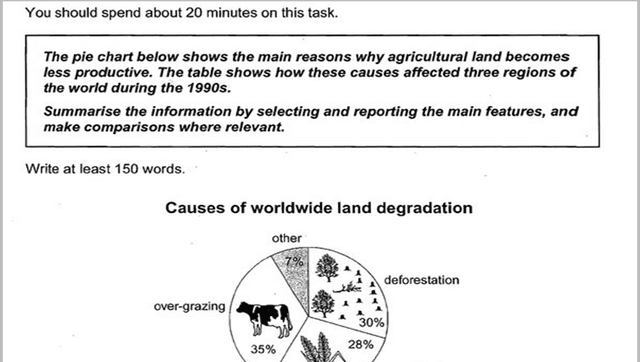
provides the contributions of each five reasons why farmland became less efficient, with a table that reveals the statistics of how North America, Europe and Oceania had been impacted by these causes during the 20th century.
From the pie Use synonyms
chart
, over-grazing was the main cause of worldwide region degradation. Use synonyms
Furthermore
, Europe was the leading continent in total area degradation.
Looking at the pie Linking Words
chart
, there are three main reasons that had led to farmland degraded, each cause contributed to just under or above one-third of the Use synonyms
chart
. Overgrazing has the largest contribution of 35%, followed by desertification which was under one-third and over-cultivation at 28%. A minority was because of other causes.
The table shows that in Europe, 23% of the total land had been degraded Use synonyms
as a result
of deforestation, over-cultivation, and overgrazing at 9.8%,7.7%, and 5.5% respectively. Over-grazing was the largest impact on just above one-tenth of the total land degraded, deforestation has contributed to only 1.7%. Linking Words
Lastly
was North America with only 5% of the total land being degraded. The most common cause was Linking Words
due to
over cultivation at 3.3% followed by overgrazing at 1.5% and Linking Words
finally
deforestation at 0.2%.Linking Words