
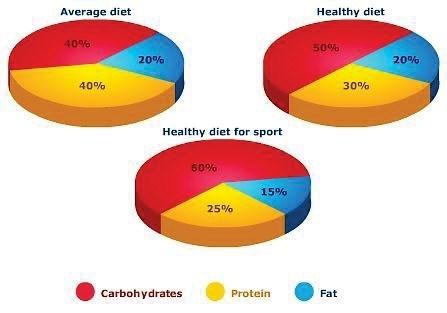
The charts illustrate data about three different ingredients:
carbohydrates
, protein, and fat of three dish programs which are: an average Use synonyms
diet
, a healthy Use synonyms
diet
and healthy Use synonyms
diet
for Use synonyms
sport
.
In brief, Use synonyms
carbohydrates
occupy the majority of three meals, Use synonyms
while
the fat takes the Linking Words
last
of the list in all of them. Linking Words
However
, protein and Linking Words
carbohydrates
comprise the same proportion in average Use synonyms
diet
.
Looking at the details, Use synonyms
it is clear that
, Linking Words
carbohydrates
in healthy Use synonyms
diet
and healthy for Use synonyms
sport
are half of the meals, whilst it takes forty percent in average Use synonyms
diet
. Protein comes in second place with 40,30 and 25 per cent in average, healthy and healthy for Use synonyms
sport
respectively. It is obvious that the fat is the least in all of them, even though it is lesser in healthy Use synonyms
diet
for Use synonyms
sport
with just 15%. Use synonyms
On the other hand
, it is one fifth ration in average and healthy Linking Words
diet
.Use synonyms