
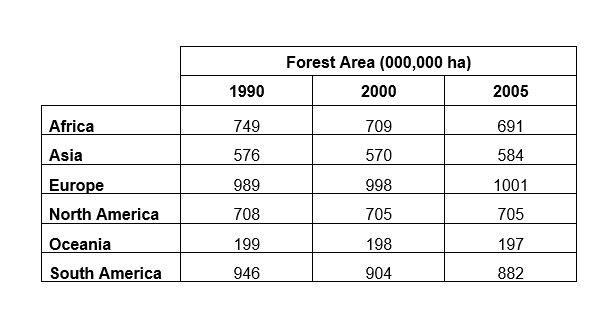
The given table illustrates green lands in millions of acres in the diversity of parts of the globe in Asia, Africa, South
America
, North Use synonyms
America
, Use synonyms
Europe
and Oceania in 1990, 2000 and 2005.
Use synonyms
Overall
, it can be seen that arable lands in all the mentioned continents decreased with the exception of Linking Words
Europe
and Asia where they experienced growth over the period.
Looking at the details, in 1990,all the six areas had productive lands from 199 to 989 and the lowest one related to Oceania and the highest one related to Use synonyms
Europe
. Followingly, these amounts saw a small decrease in 2000 Use synonyms
while
Linking Words
Europe
was the only port that grew from 989 to 998.
Use synonyms
Additionally
, the same progress was witnessed in 2005, as Linking Words
Europe
improved over thousand hectares and South Use synonyms
America
was ranked second with 882 acres. Use synonyms
Moreover
, North Linking Words
America
was the only land with the same green amount for 2000 and 2005 with 705 acres.Use synonyms